
Reston, Virginia is recognized for its planned urban framework. Green spaces are legally codified in its development charter, producing a built environment distinct from neighboring communities. I wanted to move beyond anecdote and quantify the actual environmental impact of those design choices using satellite remote sensing data.
The study overlays NASA AG100 emissivity/NDVI rasters with GCIS block-level population density across Reston, Herndon, and McNair — three communities sharing similar geography and climate, built around very different planning principles.
At matched population densities, Reston's NDVI-to-density score is 70% higher than Herndon and 2.3× higher than McNair, confirming that planned green infrastructure produces measurably better environmental outcomes regardless of population count.
Reston's mean NDVI of 52.7 exceeds Herndon (41.4) and McNair (37.5) across all density zones, a persistent gap driven by intentional green space placement around multi-unit housing.
Higher NDVI correlates with lower scaled surface temperature across the dataset. Reston hexagons with the highest vegetation scores cluster around multi-level housing with surrounding tree canopy.
Low-rise and mid-rise apartment complexes embedded in green areas produced the highest NDVI-to-density scores, the specific building typology Reston was designed around.
Dense suburban development near Dulles (MetroPark at Arrowbrook, The Point at Ridgeline) showed low NDVI despite similar population density, with minimal setback vegetation and large impervious surfaces.
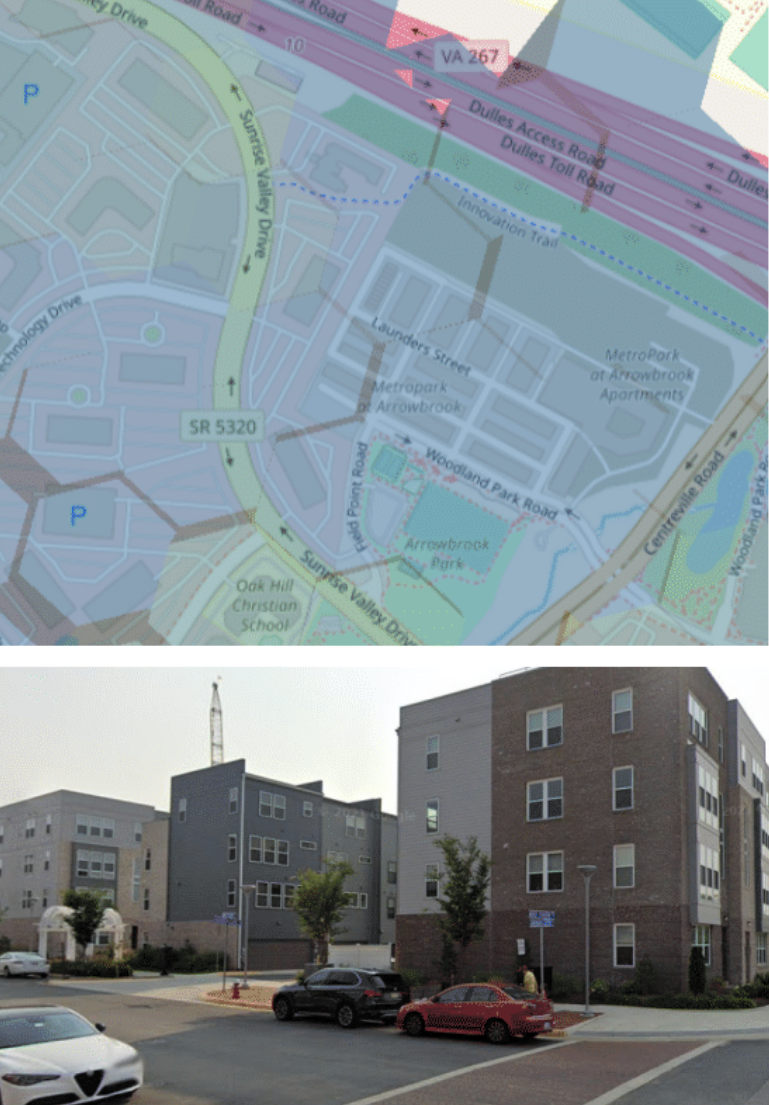
MetroPark at Arrowbrook (38.955, -77.409). Dense development near Dulles with minimal green setbacks. Low NDVI and elevated temperature despite density comparable to Reston.
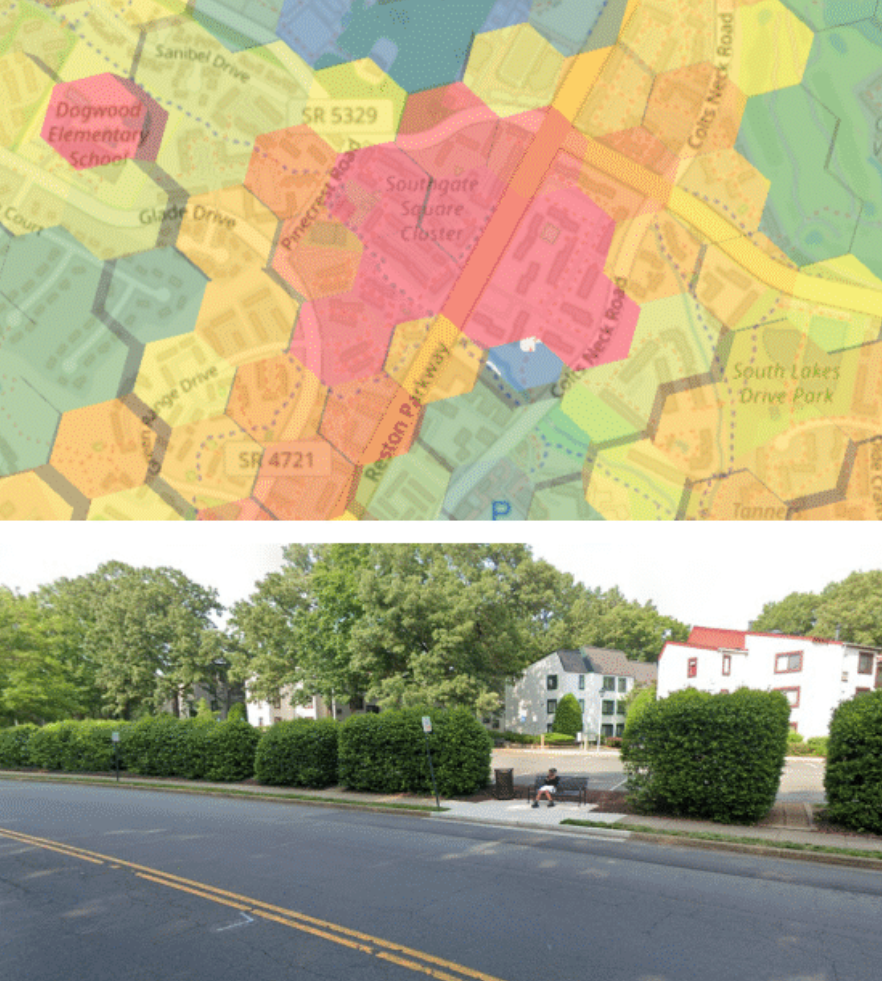
Southgate Square Center (38.943, -77.36). Multi-unit housing surrounded by canopy. Highest NDVI-to-density scores in the dataset.
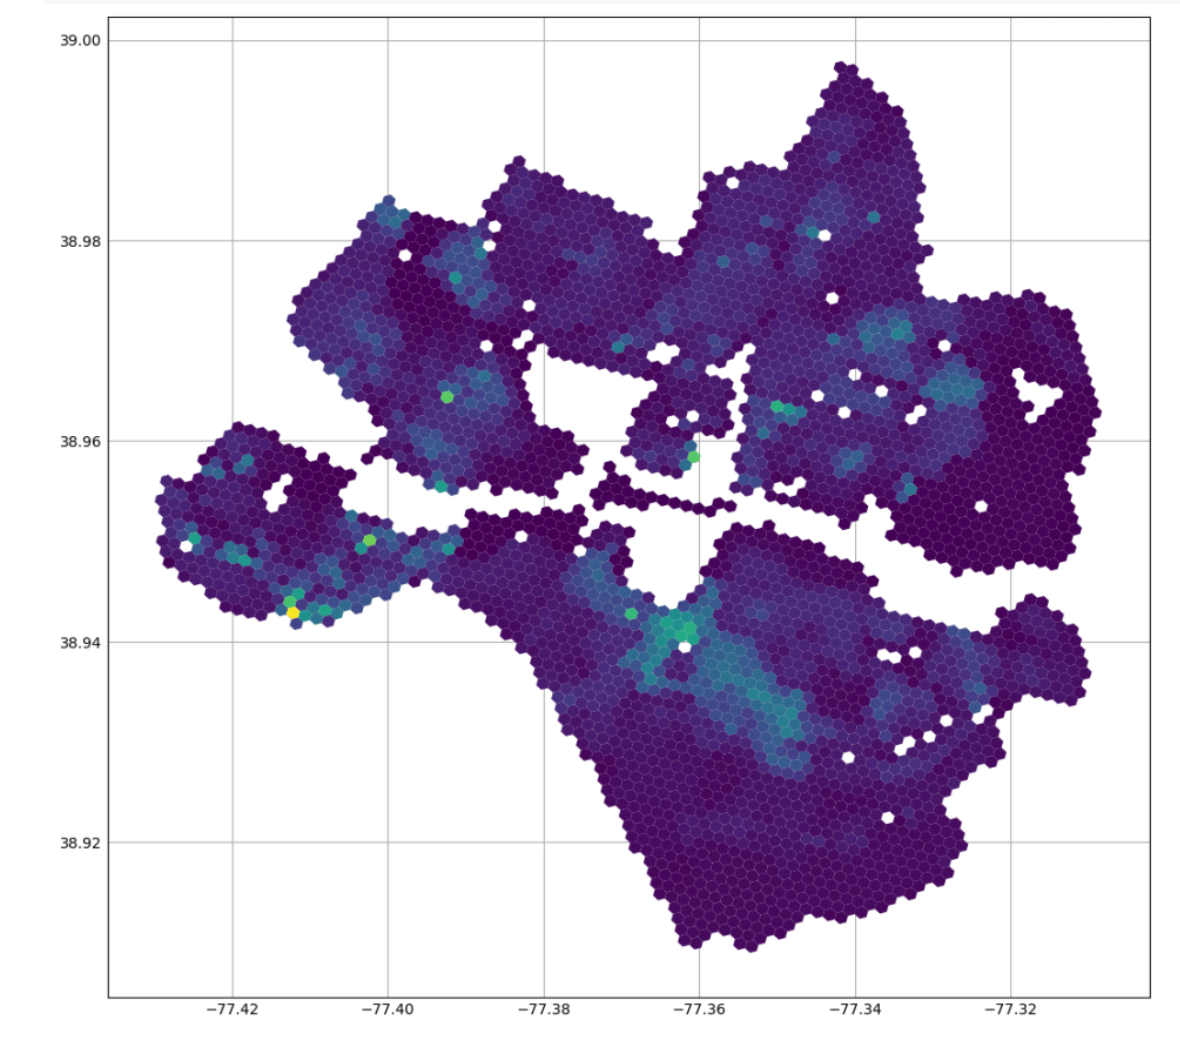
3,854 hexagons covering Reston, Herndon, and McNair after NaN removal. Blue clusters correspond to Reston's planned green corridors versus red zones in neighboring towns.
Using H3 spatial indexing to normalize two incompatible raster datasets, I demonstrated that Reston's urban planning, specifically its green corridors and intentional placement of multi-unit housing within vegetated areas, produces statistically higher NDVI and lower surface temperatures per unit of population density compared to neighboring towns.
This supports the hypothesis that zoning policy directly shapes environmental outcomes. The pattern identified — mid-rise apartments in maintained green areas — is reproducible and scalable, pointing to a concrete design prescription for sustainable urban infill.
Opens Ellipsis Drive, an interactive map viewer showing the H3 hexagon layer, NDVI raster, and population density overlay across all three cities. Toggle layers, zoom to specific neighborhoods, and inspect individual hex values directly.
